While it’s not always the case that every Python program you
write will require a rigorous performance analysis, it is reassuring to
know that there are a wide variety of tools in Python’s ecosystem that
one can turn to when the time arises.
Analyzing a program’s performance boils down to answering 4 basic questions:
How fast is it running?
Where are the speed bottlenecks?
How much memory is it using?
Where is memory leaking?
Below, we’ll dive into the details of answering these questions using some awesome tools.
Coarse grain timing with time
Let’s begin by using a quick and dirty method of timing our code: the good old unix utility time.
$ time python yourprogram.py

real    0m1.028s
user    0m0.001s
sys     0m0.003s
The meaning between the three output measurements are detailed in this stackoverflow article, but in short
real - refers to the actual elasped time
user - refers to the amount of cpu time spent outside of kernel
sys - refers to the amount of cpu time spent inside kernel specific functions
You can get a sense of how many cpu cycles your program used up
regardless of other programs running on the system by adding together
the sys and user times.
If the sum of sys and user times is much less than real time, then you can guess that most your program’s performance issues are most likely related to IO waits.
Fine grain timing with a timing context manager
Our next technique involves direct instrumentation of the code to get
access to finer grain timing information. Here’s a small snippet I’ve
found invaluable for making ad-hoc timing measurements: timer.py
In order to use it, wrap blocks of code that you want to time with Python’s with keyword and this Timer
context manager. It will take care of starting the timer when your code
block begins execution and stopping the timer when your code block
ends.
Here’s an example use of the snippet:
from timer import Timer
from redis import Redis
rdb = Redis()

with Timer() as t:
    rdb.lpush("foo", "bar")
print "=> elasped lpush: %s s" % t.secs

with Timer() as t:
    rdb.lpop("foo")
print "=> elasped lpop: %s s" % t.secs
I’ll often log the outputs of these timers to a file in order to see how my program’s performance evolves over time.
Line-by-line timing and execution frequency with a profiler
Robert Kern has a nice project called line_profiler which I often use to see how fast and how often each line of code is running in my scripts.
To use it, you’ll need to install the python package via pip:
$ pip install line_profiler
Once installed you’ll have access to a new module called “line_profiler” as well as an executable script “kernprof.py”.
To use this tool, first modify your source code by decorating the function you want to measure with the @profile decorator. Don’t worry, you don’t have to import anyting in order to use this decorator. The kernprof.py script automatically injects it into your script’s runtime during execution. primes.py
@profile
def primes(n):
    if n==2:
        return [2]
    elif n<2:
        return []
    s=range(3,n+1,2)
    mroot = n ** 0.5
    half=(n+1)/2-1
    i=0
    m=3
    while m <= mroot:
        if s[i]:
            j=(m*m-3)/2
            s[j]=0
            while j<half:
                s[j]=0
                j+=m
        i=i+1
        m=2*i+3
    return [2]+[x for x in s if x]
primes(100)
Once you’ve gotten your code setup with the @profile decorator, use kernprof.py to run your script.
$ kernprof.py -l -v fib.py
The -l option tells kernprof to inject the @profile decorator into your script’s builtins, and -v
tells kernprof to display timing information once you’re script
finishes. Here’s one the output should look like for the above script:
Wrote profile results to primes.py.lprof
Timer unit: 1e-06 s

File: primes.py
Function: primes at line 2
Total time: 0.00019 s

Line #      Hits         Time  Per Hit   % Time  Line Contents
==============================================================
     2                                           @profile
     3                                           def primes(n):
     4         1            2      2.0      1.1      if n==2:
     5                                                   return [2]
     6         1            1      1.0      0.5      elif n<2:
     7                                                   return []
     8         1            4      4.0      2.1      s=range(3,n+1,2)
     9         1           10     10.0      5.3      mroot = n ** 0.5
    10         1            2      2.0      1.1      half=(n+1)/2-1
    11         1            1      1.0      0.5      i=0
    12         1            1      1.0      0.5      m=3
    13         5            7      1.4      3.7      while m <= mroot:
    14         4            4      1.0      2.1          if s[i]:
    15         3            4      1.3      2.1              j=(m*m-3)/2
    16         3            4      1.3      2.1              s[j]=0
    17        31           31      1.0     16.3              while j<half:
    18        28           28      1.0     14.7                  s[j]=0
    19        28           29      1.0     15.3                  j+=m
    20         4            4      1.0      2.1          i=i+1
    21         4            4      1.0      2.1          m=2*i+3
    22        50           54      1.1     28.4      return [2]+[x for x in s if x]
Look for lines with a high amount of hits or a high time interval.
These are the areas where optimizations can yield the greatest
improvements.
How much memory does it use?
Now that we have a good grasp on timing our code, let’s move on to
figuring out how much memory our programs are using. Fortunately for us,
Fabian Pedregosa has implemented a nice memory profiler modeled after Robert Kern’s line_profiler.
First install it via pip:
(Installing the psutil package here is recommended because it greatly improves the performance of the memory_profiler).
Like line_profiler, memory_profiler requires that you decorate your function of interest with an @profile decorator like so:
@profile
def primes(n):
    ...
    ...
To see how much memory your function uses run the following:
$ python -m memory_profiler primes.py
You should see output that looks like this once your program exits:
IPython shortcuts for line_profiler and memory_profiler
A little known feature of line_profiler and memory_profiler
is that both programs have shortcut commands accessible from within
IPython. All you have to do is type the following within an IPython
session:
%load_ext memory_profiler
%load_ext line_profiler
Upon doing so you’ll have access to the magic commands %lprun and %mprun
which behave similarly to their command-line counterparts. The major
difference here is that you won’t need to decorate your to-be-profiled
functions with the @profile decorator. Just go ahead and run the profiling directly within your IPython session like so:
In [1]: from primes import primes
In [2]: %mprun -f primes primes(1000)
In [3]: %lprun -f primes primes(1000)
This can save you a lot of time and effort since none of your source
code needs to be modified in order to use these profiling commands.
Where’s the memory leak?
The cPython interpreter uses reference counting as it’s main method
of keeping track of memory. This means that every object contains a
counter, which is incremented when a reference to the object is stored
somewhere, and decremented when a reference to it is deleted. When the
counter reaches zero, the cPython interpreter knows that the object is
no longer in use so it deletes the object and deallocates the occupied
memory.
A memory leak can often occur in your program if references to objects are held even though the object is no longer in use.
The quickest way to find these “memory leaks” is to use an awesome tool called objgraph
written by Marius Gedminas. This tool allows you to see the number of
objects in memory and also locate all the different places in your code
that hold references to these objects.
To get started, first install objgraph:
pip install objgraph
Once you have this tool installed, insert into your code a statement to invoke the debugger:
import pdb; pdb.set_trace()
Which objects are the most common?
At run time, you can inspect the top 20 most prevalent objects in your program by running:
(pdb) import objgraph
(pdb) objgraph.show_most_common_types()

MyBigFatObject             20000
tuple                      16938
function                   4310
dict                       2790
wrapper_descriptor         1181
builtin_function_or_method 934
weakref                    764
list                       634
method_descriptor          507
getset_descriptor          451
type                       439
Which objects have been added or deleted?
We can also see which objects have been added or deleted between two points in time:
(pdb) import objgraph
(pdb) objgraph.show_growth()
.
.
.
(pdb) objgraph.show_growth()   # this only shows objects that has been added or deleted since last show_growth() call

traceback                4        +2
KeyboardInterrupt        1        +1
frame                   24        +1
list                   667        +1
tuple                16969        +1
What is referencing this leaky object?
Continuing down this route, we can also see where references to any
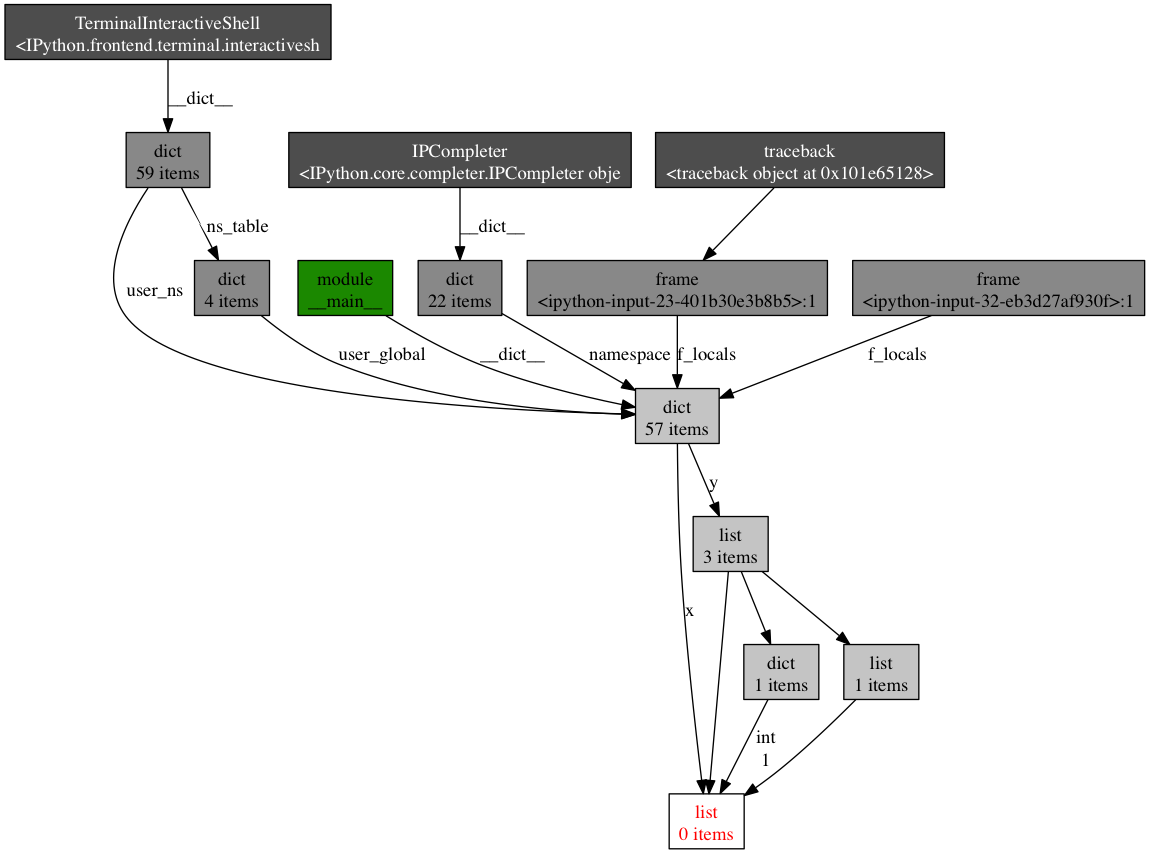
given object is being held. Let’s take as an example the simple program
below:
x = [1]
y = [x, [x], {"a":x}]
import pdb; pdb.set_trace()
To see what is holding a reference to the variable x, run the objgraph.show_backref() function:
The output of that command should be a PNG image stored at /tmp/backrefs.png and it should look something like this:
The box at the bottom with red lettering is our object of interest. We can see that it’s referenced by the symbol x once and by the list y three times. If x
is the object causing a memory leak, we can use this method to see why
it’s not automatically being deallocated by tracking down all of its
references.
So to review, objgraph allows us to:
show the top N objects occupying our python program’s memory
show what objects have been deleted or added over a period of time
show all references to a given object in our script
Effort vs precision
In this post, I’ve shown you how to use several tools to analyze a
python program’s performance. Armed with these tools and techniques you
should have all the information required to track down most memory leaks
as well as identify speed bottlenecks in a Python program.
As with many other topics, running a performance analysis means
balancing the tradeoffs between effort and precision. When in doubt,
implement the simplest solution that will suit your current needs.
Go to the beginning of the line you are currently typing on
Ctrl + E
Go to the end of the line you are currently typing on
Ctrl + L
Clears the Screen, similar to the clear command
Ctrl + U
Clears the line before the cursor position. If you are at the end of the line, clears the entire line.
Ctrl + H
Same as backspace
Ctrl + R
Let’s you search through previously used commands
Ctrl + C
Kill whatever you are running
Ctrl + D
Exit the current shell
Ctrl + Z
Puts whatever you are running into a suspended background process. fg restores it.
Ctrl + W
Delete the word before the cursor
Ctrl + K
Clear the line after the cursor
Ctrl + T
Swap the last two characters before the cursor
Esc + T
Swap the last two words before the cursor
Alt + F
Move cursor forward one word on the current line
Alt + B
Move cursor backward one word on the current line
Tab
Auto-complete files and folder names
Note that some of these commands may not work if you are accessing
bash through a telnet/ssh session, or depending on how you have your
keys mapped.
(st)
1. The client sends an EAP Start message to the access point
2. The access point replies with an EAP Request Identity message
3. The client sends its network access identifier (NAI), which is its username, to the access point in an EAP Response message
4. The access point forwards the NAI to the RADIUS server encapsulated in a RADIUS Access Request message
5. The RADIUS server will respond to the client with its digital certificate
6. The client will validate the RADIUS server's digital certificate
7. The client and server negotiate and create an encrypted tunnel
8. This tunnel provides a secure data path for client authentication
9. Using the TLS Record protocol, a new EAP authentication is initiated by the RADIUS server
10. The exchange will include the transactions specific to the EAP type used for client authentication
11.
The RADIUS server sends the access point a RADIUS ACCEPT message,
including the client's WEP key, indicating successful authentication
In many cases you probably want to filter a raw data file in various fashions before plotting the data with Gnuplot. In some cases, you may want to use only specific rows (e.g., from line 10 to 100) of a data file in your plot. With gnuplot, you can specify a range of data to plot in two different ways.
Method One
The first method is to use gnuplot's "every" option in the plot command. The "every" option is used in the following form:
plot "my.dat" every A:B:C:D:E:F

A: line increment
B: data block increment
C: The first line
D: The first data block
E: The last line
F: The last data block
To plot the data starting from line 10:
plot "my.dat" every ::10
To plot the data from line 10 to line 100:
plot "my.dat" every ::10::100
To plot data starting from the first line till line 100:
plot "my.dat" every ::::100
Method Two
An alternative way to plot specific rows of data file is to use input
redirection. That is, use any external program to process raw data
file, and redirect the output to gnuplot. Assuming that sed is installed on your Linux system, you can simply do:
plot "<(sed -n '10,100p' my.dat)"
As you can imagine, sed program prints out data between line 10 and line 100, and feeds it to gnuplot for plotting.
However, ctime, dtime, ttime & wait are not documented.
Through Wireshark wrangling and reading the ab source file, I managed to figure out what they are:
assumes first byte from server comes after when the request is written
the diagram is ugly, sorry
If it still isn’t clear, or if it’s inaccurate, please tell me.
Thù lao
luôn là vấn đề nan giải đối với các freelancer, nhất là những bạn mới
vào nghề
vì thu nhập còn thấp và chưa có nhiều kinh nghiệm rút tiền khi hai trang
này đều
hỗ trợ nhiều phương thức thanh toán. Mình đã có 4 năm làm việc và thú
thật là
mình đã có một thời gian không tìm hiểu về các vấn đề thanh toán nên có
thể là đã lãng phí rất nhiều tiền từ việc rút tiền thù lao về Việt Nam.
Bài viết
này xin chia sẻ một số kinh nghiệm, có thể chưa là giải pháp tối ưu nhất nhưng
chắc sẽ giúp ích được nhiều bạn.
Hướng dẫn chung
Mỗi tài khoản
trên Upwork và Elance đều có số dư (balance), sau khi hoàn thành dự án cho
khách hàng bạn phải yêu cầu khách thanh toán hoặc giải phóng (release) số tiền
được giữ trong Escrow. Tuy nhiên có vài vấn đề bạn cần lưu ý:
Đây là email thông báo từ Elance khách đã giải phóng thù lao cho một dự án của mình.
Upwork email thông báo khi khách hàng gửi tiền và đặt tiền cọc mới.
1. Nếu dự
án bạn đang làm được tính theo giờ thì sau mỗi tuần, số thời gian bạn làm được
sẽ nhân với đơn giá đã thỏa thuận và khách hàng sẽ bị trừ số tiền đó. Tóm lại
là hoàn toàn tự động.
2. Đối với Upwork thì mọi thanh toán đều bị hold (giữ lại) để kiểm tra trong khoản 1 tuần mới
được đưa vào tài khoản của bạn còn Elance thì ngay tức thì. Tuy nhiên Upwork khi
có tiền rồi nếu bạn thực hiện thanh toán rút thì được giải quyết ngay tức thì
còn Elance thì phải đợi (tối đa 24 giờ đối với các ví điện tử).
3. Mỗi
trang đều hỗ trợ một số phương thức nhưng bạn phải thực hiện add các phương thức
vào và xác nhận, sau khi hoàn tất thì đợi vài ngày mới dùng được.
4. Có nhiều
khách hàng hoặc chính bạn đề nghị khách hàng thanh toán riêng cho bạn để tiết
kiệm phí trung gian của hai trang này. Việc làm này có lợi hay hại sẽ được mình
bàn ở một bài khác vì có nhiều thứ đáng nói.
5. Khách
hàng có thể thanh toán thưởng ngoài số tiền đã giao kèo (deal), tuy nhiên số tiền
đó vẫn bị tính phí hoa hồng như bình thường.
Phương thức của tác giả
là mình áp dụng để tối ưu chi phí ở 2 trang là:
Upwork: Rút
về Paypal
Elance: Rút
thẳng về Việt Nam (bank wire)
Tài khoản Paypal và
Skrill đều liên kết với thẻ MasterCard của ngân hàng ACB. Thủ tục làm thẻ chỉ
trong 15 phút, phí thường niên 100k (miễn phí năm đầu).
Và một số kinh nghiệm
chung:
- Nên rút mỗi tháng một lần
- Không nên quá trông chờ vào thu nhập
Freelancer cho chi phí hiện tại mà nên dự tính cho tháng tới.
- Làm sẵn thẻ Master, verify và gắn với
tài khoản Paypal, Skrill sẵn để tiện rút bất kỳ lúc nào.
- Không nên hối thúc khách hàng thanh
toán trừ khi họ đã trễ hẹn
- Nên đăng ký nhận thông báo tiền qua
điện thoại (SMSBanking hoặc iBanking) để biết khi nào tiền về
Xin đọc tiếp
để hiểu tại sao như vậy là rẻ nhất
Upwork (oDesk)
Như đã nói ở
phần trước, phí hoa hồng thanh toán của Upwork
là 10%. Tạm bỏ qua các vấn đề về thỏa thuận riêng với khách hàng. Ở đây chúng
ta sẽ đi nhanh về các phương thức Upwork hỗ trợ:
1.Payoneer: cái này mình không có dùng nên
không bàn tới, nghe nói phổ biến cho bên Philipines
2.Skrill: khá tuyệt vời, tỷ giá chuyển đổi USD > Việt
Nam Đồng cao và lệnh rút tiền được giải quyết trong 24 giờ. Tức là hôm nay rút
sớm (trong buổi chiều) thì mai có tiền (không tính Chủ Nhật). Phí rút một lần 1
USD. Khi rút về Skrill sẽ bị charge phí nhận tiền 3,9%.
3.Direct Deposit/ACH: Cái này dành cho các freelancer ở Mỹ
4.Wire Transfer: 30$ một lần rút. Mình chưa dùng bao
giờ vì thường không để quá nhiều tiền ở trang này, nếu bạn có số dư tầm 1000$
trở lên thì hãy rút bằng phương thức này vì nó tiết kiệm hơn nếu rút qua Paypal
hay Skrill.
5.Paypal:phương thức mình ưa dùng nhất khi rút tiền. Paypal
thật ra tính phí cao hơn Skrill, các bạn có thể google “Paypal calculator” để
biết, cách tính của Paypal phức tạp hơn nhưng nói chung khi nhận tiền tự do sẽ
bị charge phí cao hơn. Tuy nhiên Paypal không charge phí với các partner (đối
tác) của nó và Upwork là một trong những đối tác lớn nên bạn không mất xu nào
khi nhận tiền qua Paypal.
Lưu ý: Như đã nói ở trên, Upwork giữ thanh toán của
khách hàng 1 tuần mới ghi có vào tài khoản của bạn. Nếu số dư của bạn hơn 1000$
thì Upwork sẽ tự động rút về hằng tháng cho bạn, việc này bạn có thể điều chỉnh
lại để thanh toán tự động theo tuần, hai tuần một lần, theo tháng hoặc theo quý
và chọn mức số dư bạn muốn tự động rút.
Nếu bạn là
một freelancer bình thường sống ở Việt Nam không buôn bán Skrill, không có làm
dự án quá to hay thích để dành tiền > 1000$ mới rút thì Paypal là lựa chọn tốt
nhất.
Elance
Nhắc lại,
phí hoa hồng thanh toán của Elance là 8,25-8,75%. Và đây là danh sách các
phương thức Elance hỗ trợ:
1. Bank Transfer (chuyển khoản ngân
hàng):Trước khi dùng nó, mình cũng dùng
Paypal và Skrill, tuy nhiên khi biết Elance có hỗ trợ rút thẳng về Việt nam thì
chuyển sang dùng cái này vì mỗi tháng Elance cho bạn rút miễn phí một lần, những
lần rút kế tiếp thì charge phí 5$. Nên nếu bạn rút định kỳ theo tháng thì nên
dùng cái này. Tuy nhiên, tỷ giá của Elance khá thấp, tương tự Paypal, và thời
gian rút khoản 3 ngày. Ví dụ bạn rút thứ hai thì thứ năm có tiền trong tài khoản.
2. Paypal: Không charge phí rút. Lâu quá mình không rút về
Paypal nên không rõ có bị charge phí nhận tiền không nữa.
3. Skrill: Không charge phí rút. Rút về vẫn bị tính 3,9%
phí nhận tiền.
So sánh giữa Paypal và
Skrill
Paypal:
Ưu điểm:
+ Uy tín
+ Đa chức năng
+ Có thể check tỷ giá tiền (USD/VND)
+ Chuyển khoản qua lại giữa các tài khoản không
mất phí
Nhược điểm:
+ Thời gian rút lâu (đối với VN là 3 ngày,
không tính T7, CN)
+ Tỷ giá thấp hơn so với thị trường vì phải qua
trung gian. Ví dụ tỷ giá chính thức là 22.500VND/USD thì Paypal chỉ khoảng
21.634VND/USD
Skrill:
Ưu điểm:
+ Tốc độ xử lý nhanh
+ Giao diện đơn giản dễ dùng
+ Thời gian rút tiền cực nhanh trong 1 ngày
+ Tỷ giá quy đổi ngoại tệ lớn (không bị ăn phí
trung gian)
+ Có nhiều loại thành viên và chế độ tích lũy
điểm đổi quà.
Nhược điểm:
+ Luôn luôn tính phí nhận tiền 3,9% với mọi nguồn
tiền nhận được
+ Chuyển tiền qua lại giữa các thành viên vẫn bị
tính phí
+ Không có cơ chế lấy lại tiền nếu tài khoản bị
hack như Paypal cho tài khoản thường.
Các bạn có
bất kỳ câu hỏi về thanh toán nạp rút ở hai trang Upwork và Elance xin để lại
bình luận, mình sẽ trả lời sớm nhất khi có thể.